See how all assessments are performing. And compare psychometric data of multiple versions to see if improvements are working.
The Assessment Performance report offers the opportunity to review the overall psychometrics for each of your assessments. Using this you can evaluate your assessments and how well the questions in them perform.
How to get here:
- Go to Reports > Assessment performance
Performance reports
The ‘Assessment performance’ report allows you to:
- Search for assessments in Assessment performance list
- View a high-level overview on your assessments
- Last sat, pass rate, reliability, times delivered and number of Items in the assessment
- Drill down the results shown to any specific assessment: simply click on an assessment title to view more detailed assessment statistics
- Export this data
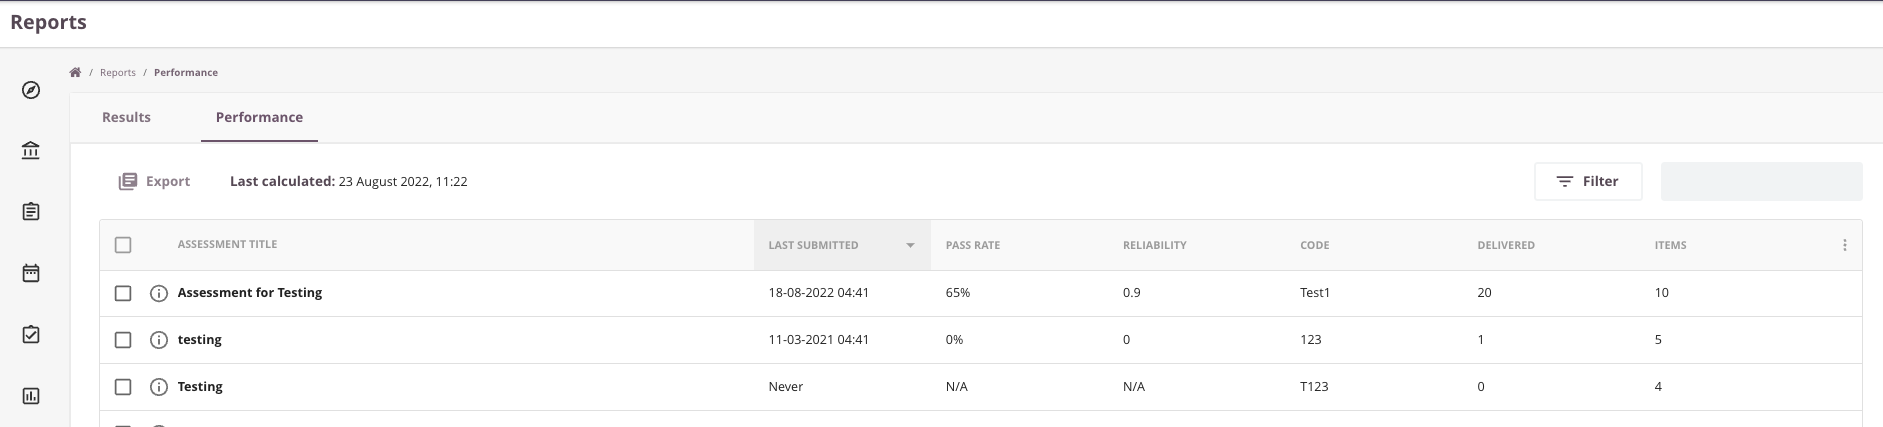
When you click on the assessment title you will see more detailed information:
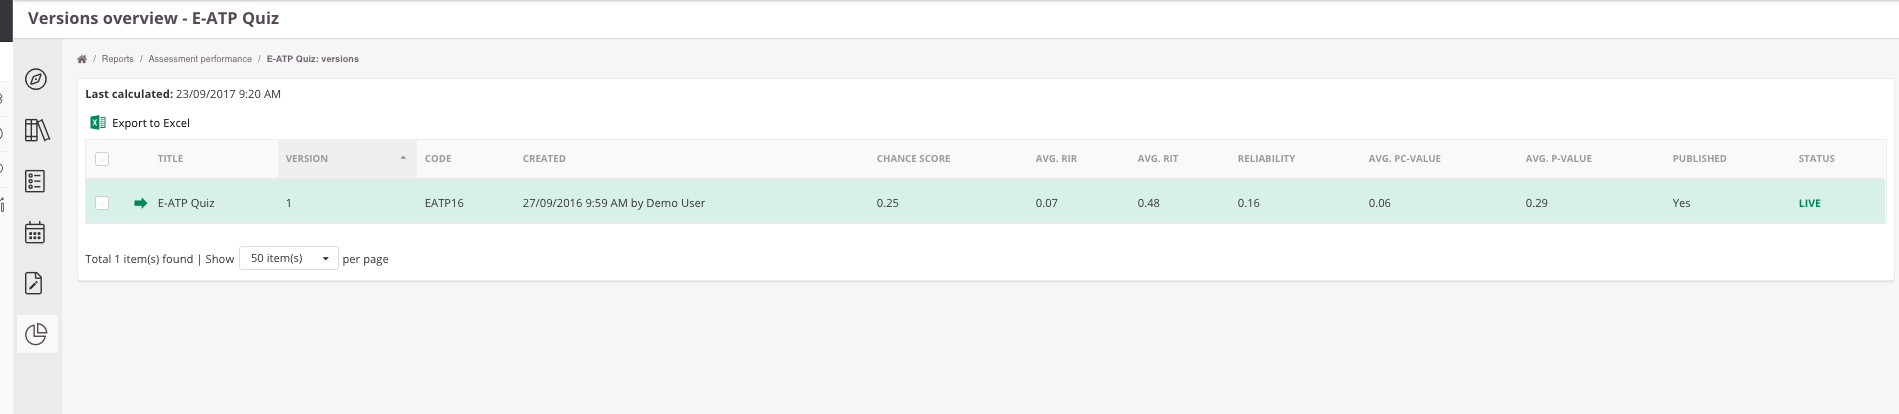
- Average Chance score for the assessment
- Average Rir value
- Average Rit value
- Reliability for the assessment
- Average Pc-Value (corrected P value)
- Average P-value (difficulty)
Reliability formula
Reliability is based on the following Cronbach Alpha formula:
Reliability (Cronbach Alpha)= (N/(N-1))(1-Sum(Si^2)/Sx^2)
| N | number of Items |
| Sum Si^2 | sum of the item varianceSum Si^2: sum of the item variance |
| Sx^2 | the assessment variances |
| Sx^2 | sum(score - average score)^2/ number of candidates |
| Tip: - You can read more about Rit and Rir in our article 'Reports: assessment performance statistics'. - You can read more about P and Pc-values in our article 'Library: statistics on Items' |
Clicking once more on the assessment title will lead you to a list of the items in your assessment and their statistics at item level measured for the assessment:
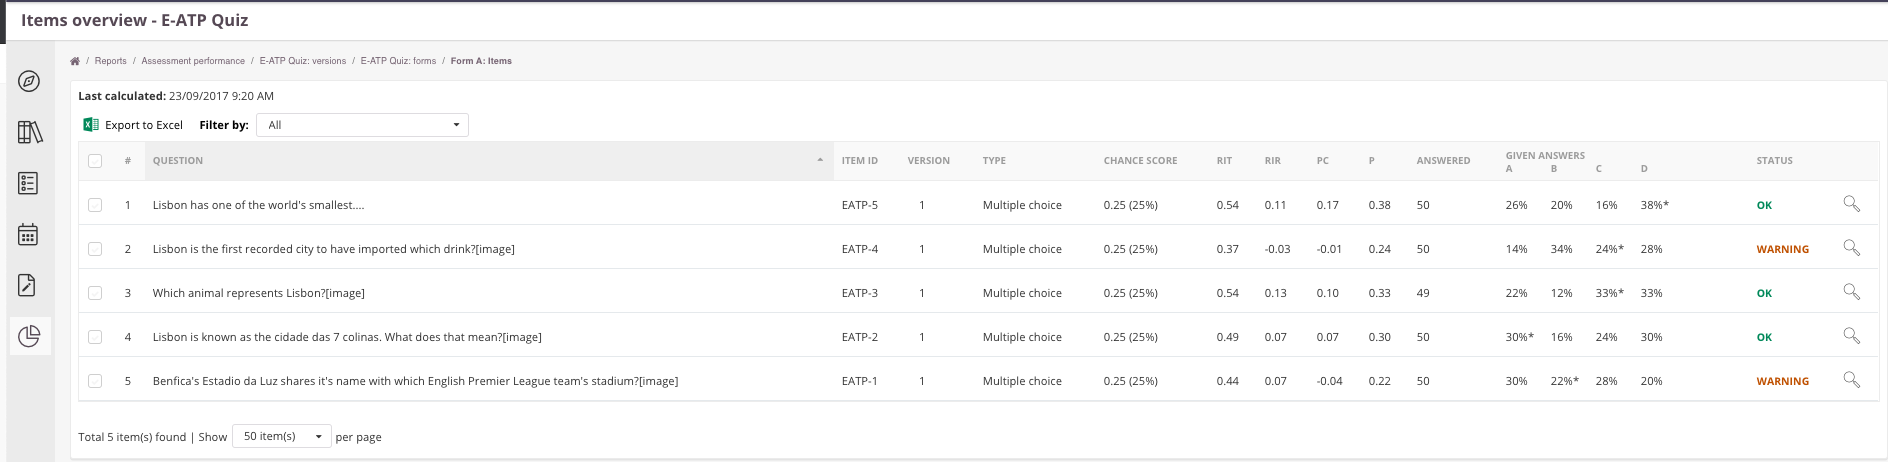 Please note: this Report is in bèta - Feel free to share your thoughts and suggestions via our customer portal
Where/when will the statistics show up?
Where
Psychometric data can be found on multiple places in the the Cirrus Platform:
- Library>Collection
- Assessment
- Reports>Assessment Performance
When
The statistics will be calculated based on 2 criteria:
- At the very end of the schedule
- When ALL candidates are submitted (also "not handed in" results).
A few scenario's to explain:
Rescoring
For rescoring the statistics will be re-calculated in the rescoring took place after the marking process.
In case the rescoring takes place during marking (before publishing all candidate results from that specific schedule), no calculation will be done.
Scenario 1 criteria (auto-scored):
- You have a completely auto-scored exam ('do not assign assessor' is checked in assessment publish settings).
- Schedule start date 04 April 2021 - schedule end date 14 April 2021
- 50 candidates in total
In this scenario all the statistics will be calculated on 14 April 2021 (end of schedule).
OR sooner if:
All 50 candidates have taken the attempt.
In case 1 candidate did not participate, you will have to wait till the end of the schedule, because once the schedule end, the 'not handed in' results will be auto-submitted by the system.
Removing the candidate from the schedule will not trigger new calculation.
In case all candidates took the exam and calculation was done and a new candidate will be added within the schedule window, a re-calculation will be done directly after this attempt.
Scenario 2 criteria (manual scored):
- You have a manual scored exam ('simple/extended' is checked in assessment publish settings).
- Schedule start date 04 April 2021 - schedule end date 14 April 2021
- 50 candidates in total
- multiple assessors in assessor pool
In this scenario all the statistics will be calculated once ALL results are submitted by the assessors from the schedule, including 'not handed in' results. This could be before or after the schedule deadline. This depends if you also submit 'not handed in' candidates.
Access to assessment performance reports
In order to be able to view Assessment Performance reports your Admin needs to have set this up for you. This is a role-based setting - access is not differentiated like the Results reports but is all-or-nothing access.
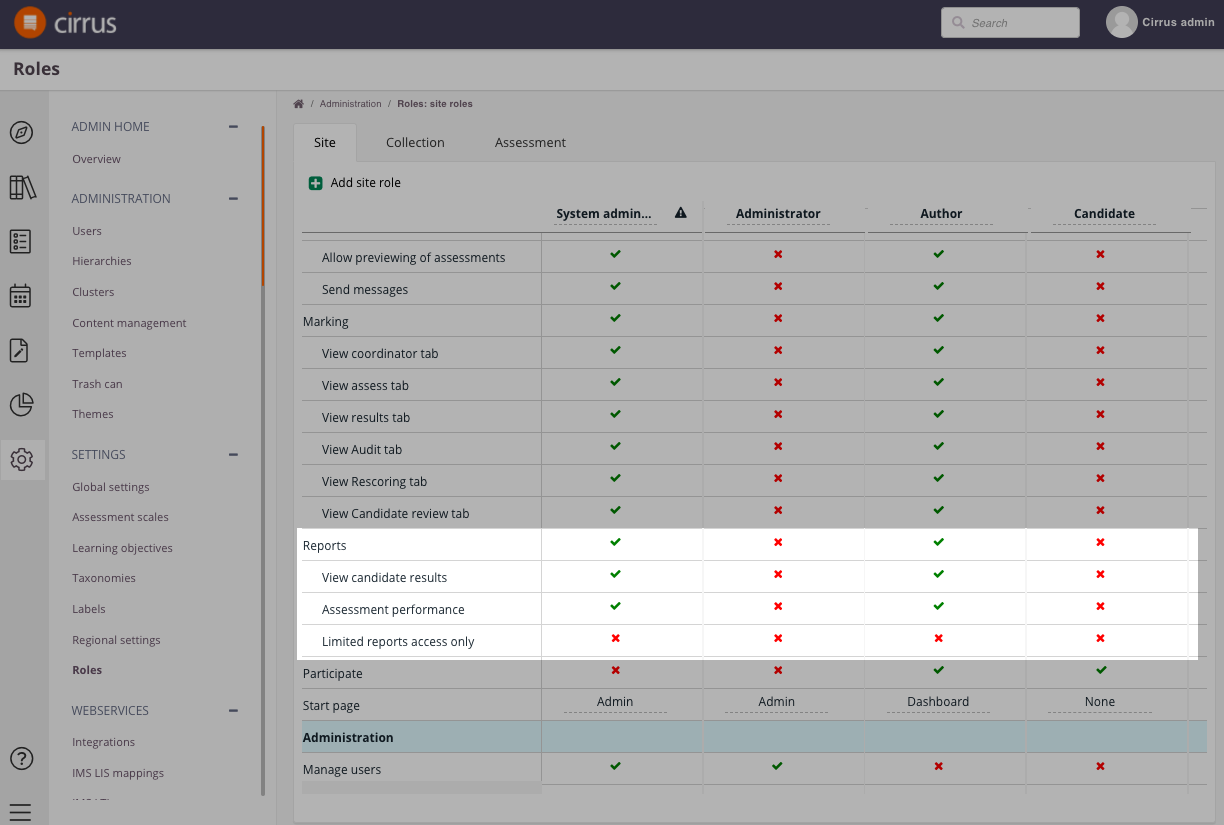
- Go to Admin > Roles > Reports > Assessment Performance
- For the applicable role select access by checking the box: