
We sometimes get questions on the statistics shown for Assessments. This article briefly describes the most important values shown.
Item discrimination ‑ rit and rir values
What does it mean?
In short The Rit‑value indicates correlation of question score to the total examination score. It tells us to what extent an item contributes to isolating the good candidates from the entire pool of candidates. In other words: it demonstrates the discriminating properties of the item and tells something about the performance of the item versus the test as a whole.
The Rir‑value is similar to Rit but more precise because the score of the item itself is not taken into account.
Calculation: the following formula is used to calculate Rir and Rir:
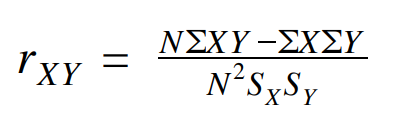
Rit: X = item scores, Y = assessment scores
Rir: X = item scores, Y = (assessment scores ‑ the item score of the item)
N = number of attempts
S = Standard Deviation
[Source: ‘Tentamineren’ van Wolters Noordhoff (T.Dousma/A.Horsten/J.Brants), page 184]
Rules of thumb:
- These values form a starting point for evaluation only.
- Avoid questions with Rit‑value below 0.20
- Always look at P in combination with Rit
- Rule of thumb: Avoid questions with P‑value above 0.90 or below 0.10