

Statistics are available in several areas of the platform. This article describes the Statistics tab within a collection in the Library.
For every question in a collection, Cirrus tracks performance data.
Access to the statistics tab
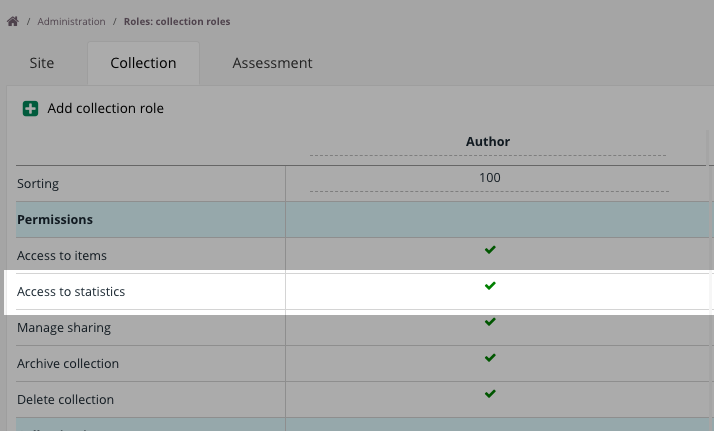
To access the Statistics tab, you must have the Access to statistics permission under Roles → Collection.
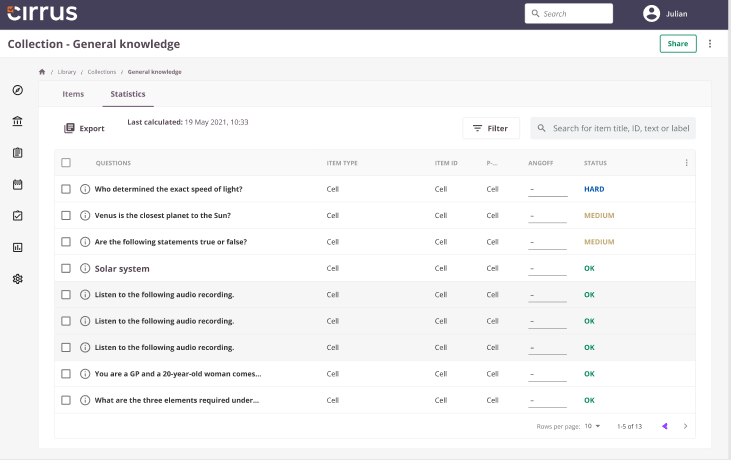
Statistics
The Statistics tab shows the following data.
Chance score
There is a distinction between chance and chance score. For example, a Multiple Choice question with four options has a 1-in-4 chance (25%) of a correct answer by chance. If the maximum score is 1, the chance score is 0.25. If the maximum score is 3, the chance score is 25% of 3 = 0.75. Cirrus always displays the Chance Score as a percentage of the maximum score.
Chance score is not available for Fill in the Blank, Hotspot, Sowiso, Numeric, Short answer, Essay, and File response questions.
P value
The difficulty value of the item.
The item difficulty level is based on the P-value, one of the core concepts in psychometrics. Difficulty is important for evaluating whether an item should remain in the assessment. Items that are too easy or too hard are often removed.
| Range | Interpretation | Notes |
|---|---|---|
| 0.0 - 0.3 | Hard | Candidates are at or below the chance level; the item may be too difficult or have other issues. |
| 0.3 - 0.7 | Medium | 0.3 - 0.5: Items in this range will challenge even top candidates. 0.5 - 0.7: These items are fairly common and slightly easier. |
| 0.7 - 1.0 | Easy | The higher the P-value, the easier the item. |
Calculation: P = average score of all candidates / maximum score for the question.
Pc value
The corrected difficulty value for the item.
Also known as P', this is similar to the P-value but accounts for the chance score of the item.
Angoff
Angoff value described in the Angoff method article. Only visible if activated.
Used in
Indicates the number of assessments in which the item is included.
There are important distinctions based on assessment type:
-
Manual assessments
- The item is counted in Used In if it is in the question selection and the form is random.
- If the item is in the question selection but the form is fixed and the item is not placed on the form, it is not counted.
-
Blueprint-based assessments
- The item is counted in Used In if its associated learning objective, taxonomy, or topic is included in the blueprint matrix.
Attempts
Shows the total number of times an item was answered by candidates across all assessments.
In the screenshot below, item MCQ-08 Version 1 is used in four assessments and has been attempted six times.
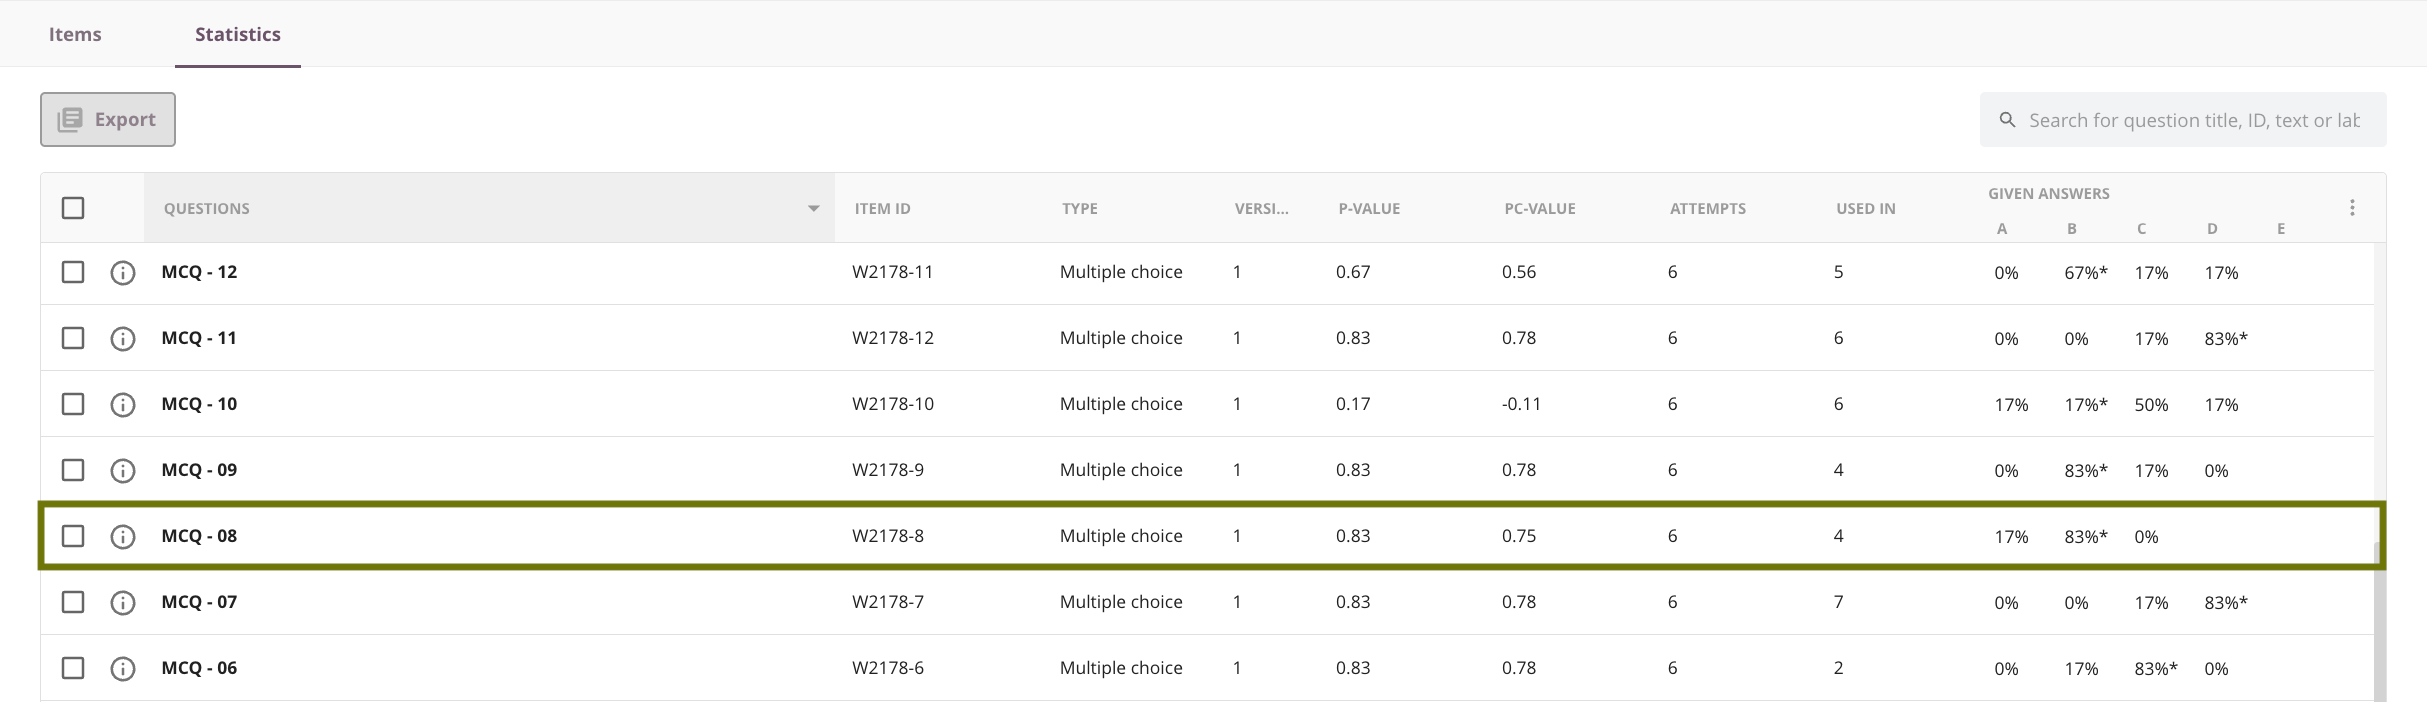
Click the i icon next to the item title to view all details. Then click the Used In arrow to see which assessments include the question.
Answered
The last date the item was answered. Statistics are updated only when results are published. The timestamp at the top shows when statistics were last calculated.
Given answers
Shows the percentage of candidates who selected each answer option, applicable mainly to questions with alternatives.
Status
An indicator of item difficulty (Hard, Medium, Easy). See item difficulty level thresholds for more information.
When evaluating items, also consider the Rit value within the context of an assessment. See also Reports in Cirrus: Assessment performance.