

Read built-in dashboards covering platform usage, assessment psychometrics, and candidate participation. Use this article to understand the Insights area in Reports and what each graph shows.
Where to find Insights
Open Reports > Insights. Depending on your subscription tier, the Insights area contains up to three tabs:
- Overview for platform usage and headline metrics.
- Psychometrics for assessment-quality statistics.
- Candidates for candidate participation and attempt patterns.
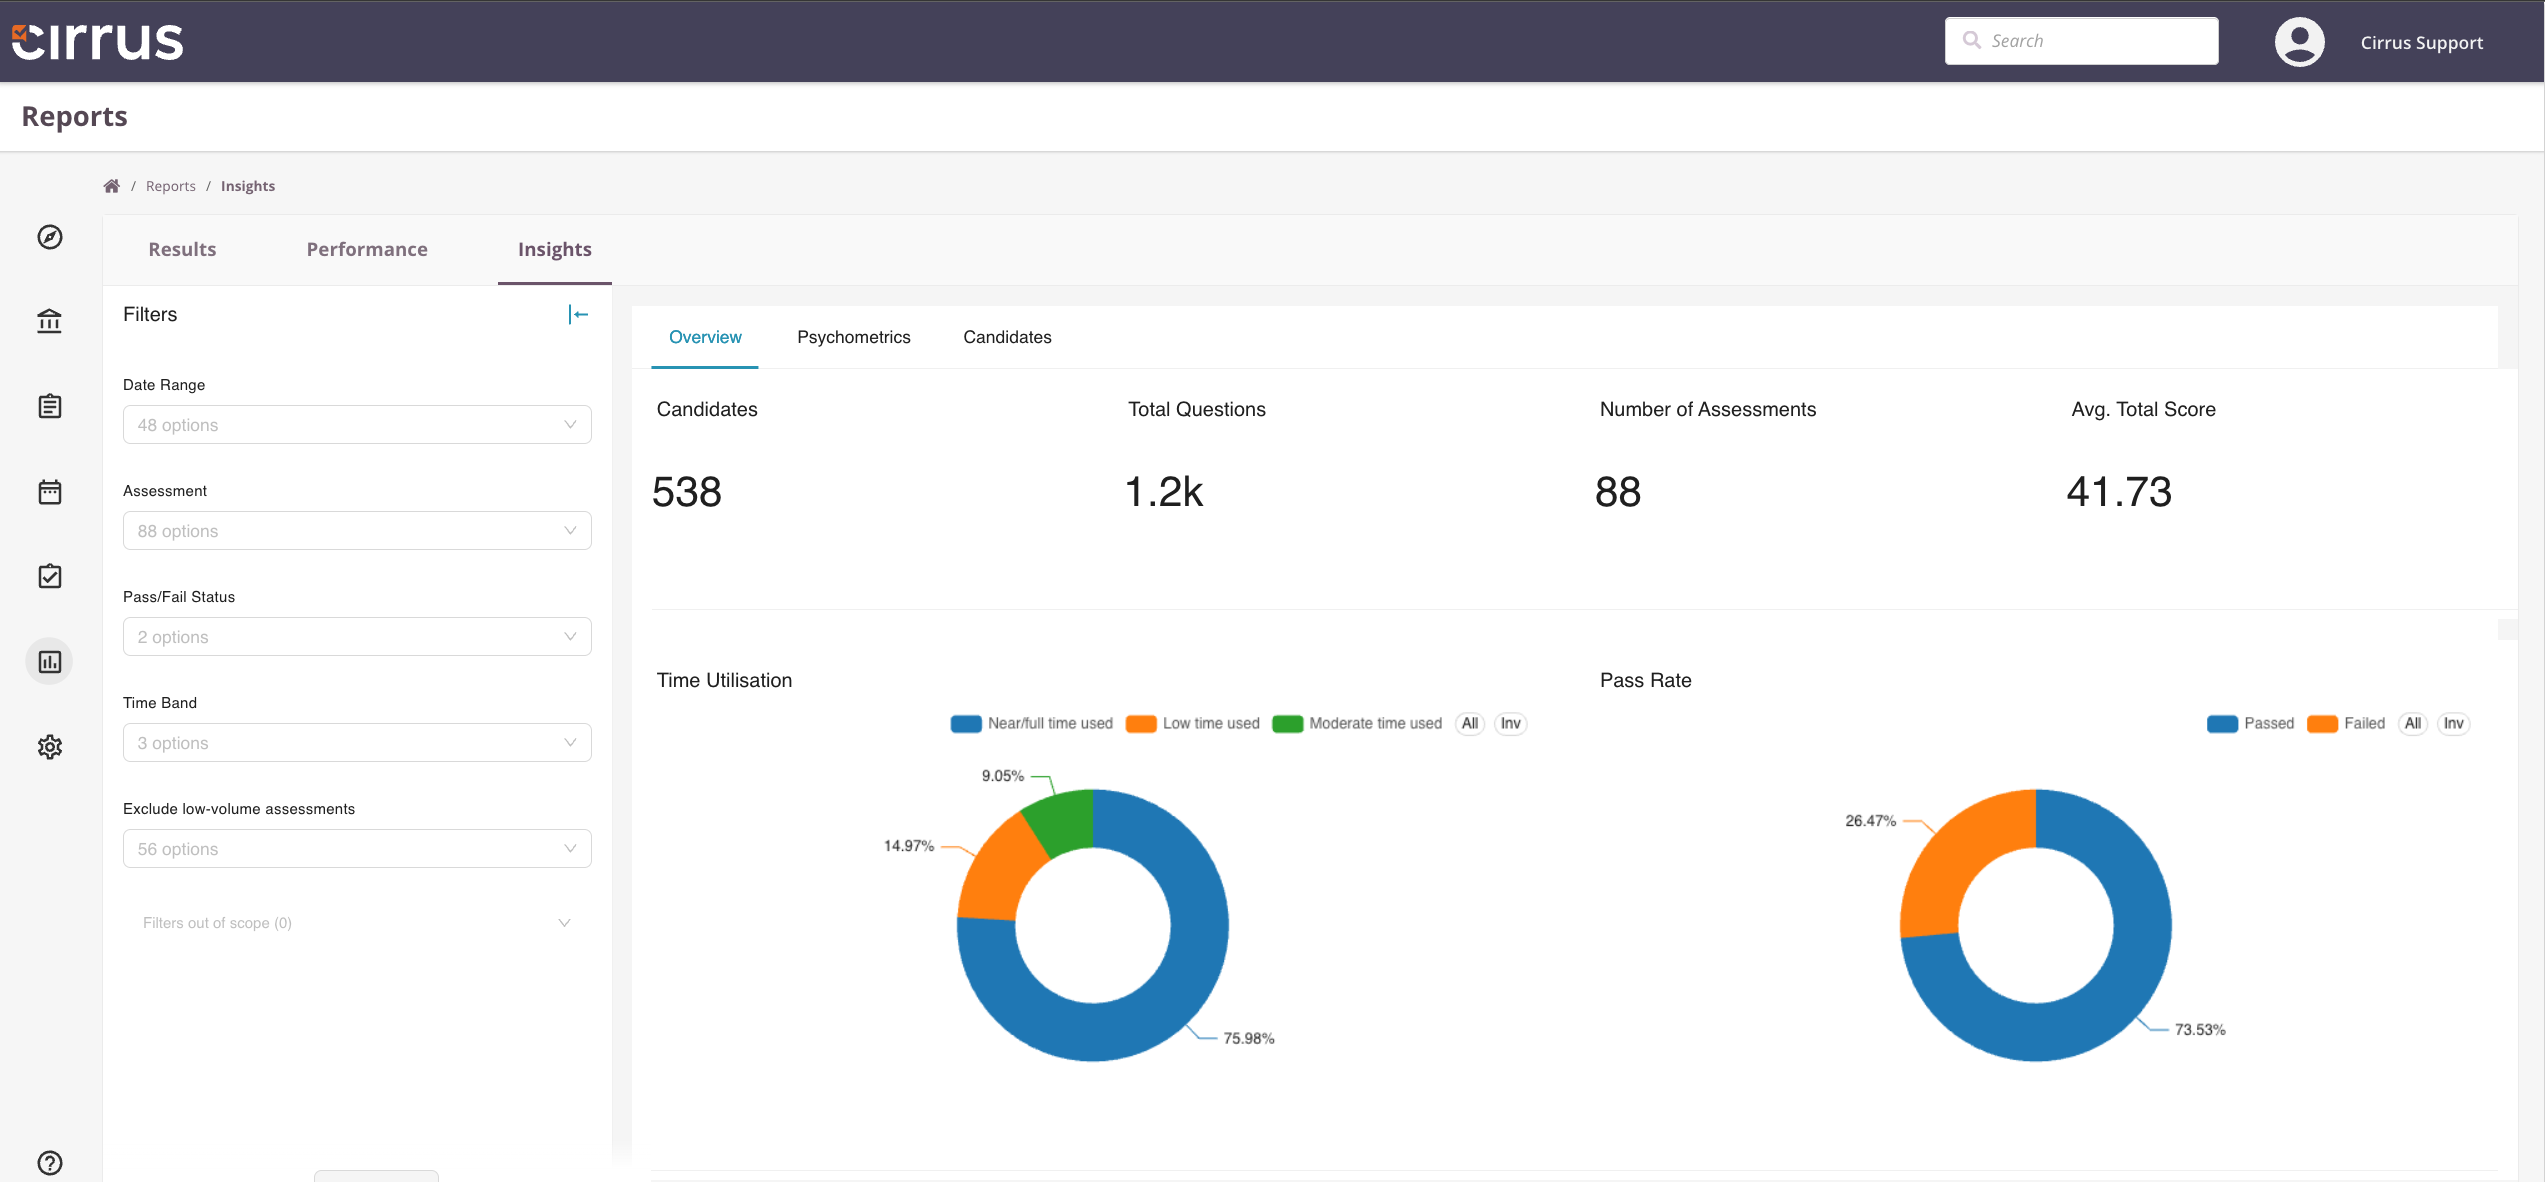
Overview tab
The Overview tab shows headline numbers and trends across your platform.
Available graphs and metrics:
- Total candidates
- Total questions
- Total assessments
- Average total score
- Time utilisation
- Pass rate
Psychometrics tab
The Psychometrics tab focuses on the statistical quality of your assessments.
Available graphs and metrics:
- P value versus RIT (item-test correlation)
- P value versus RIR (item-rest correlation)
- P value versus pass rate
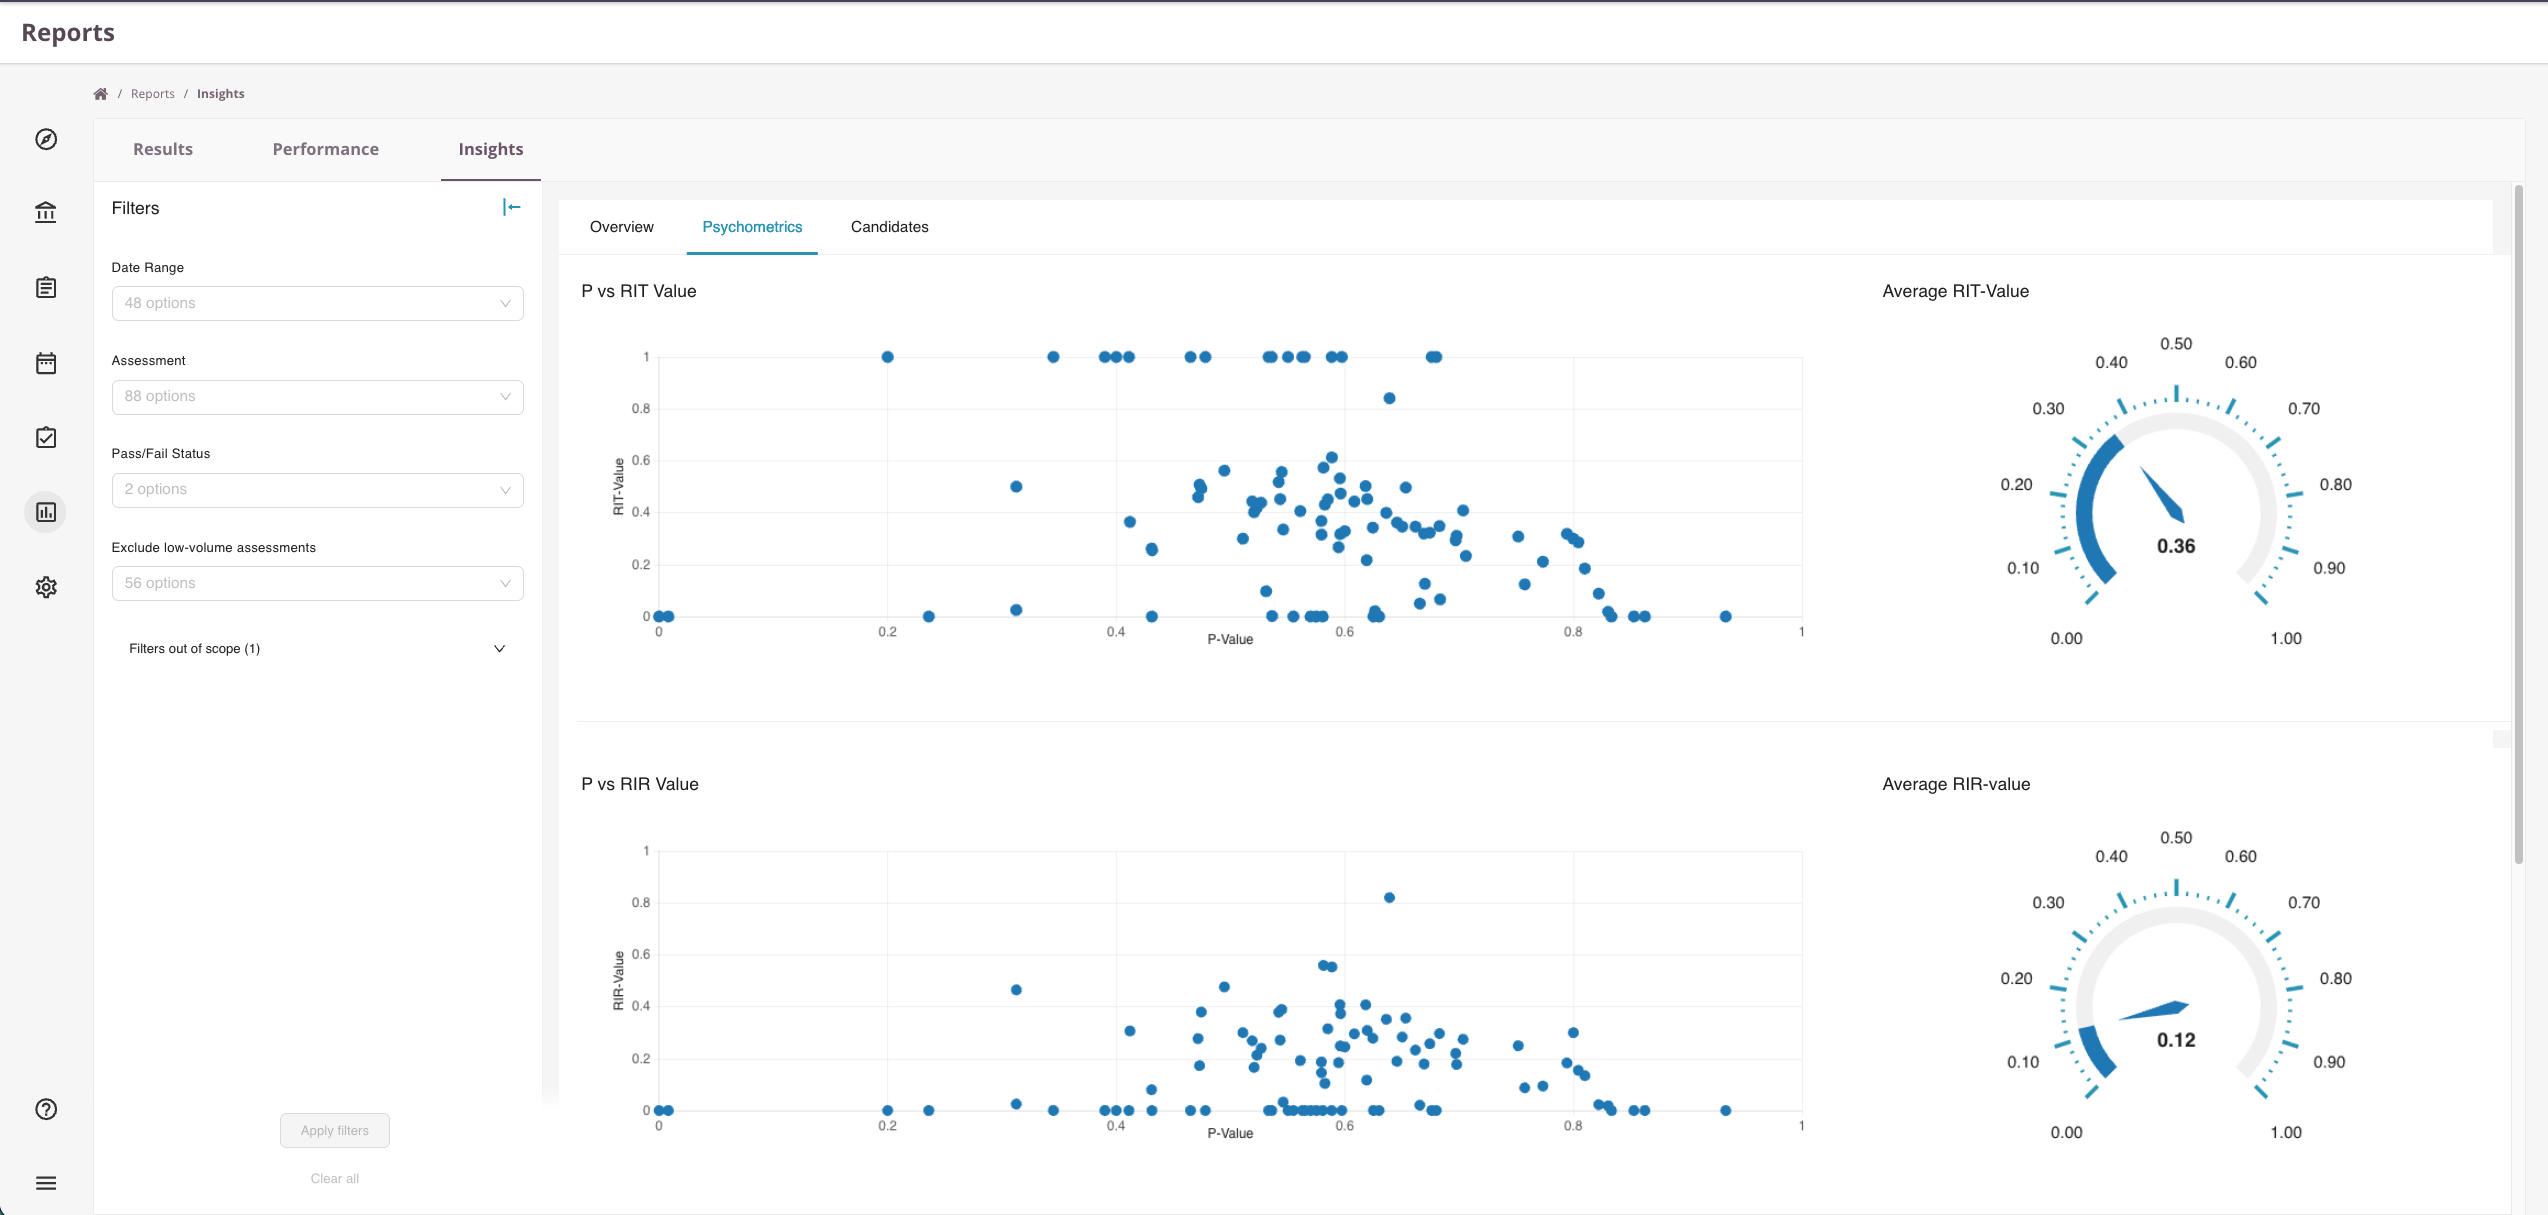
For background on the metrics themselves, see Statistics: RIT and RIR values.
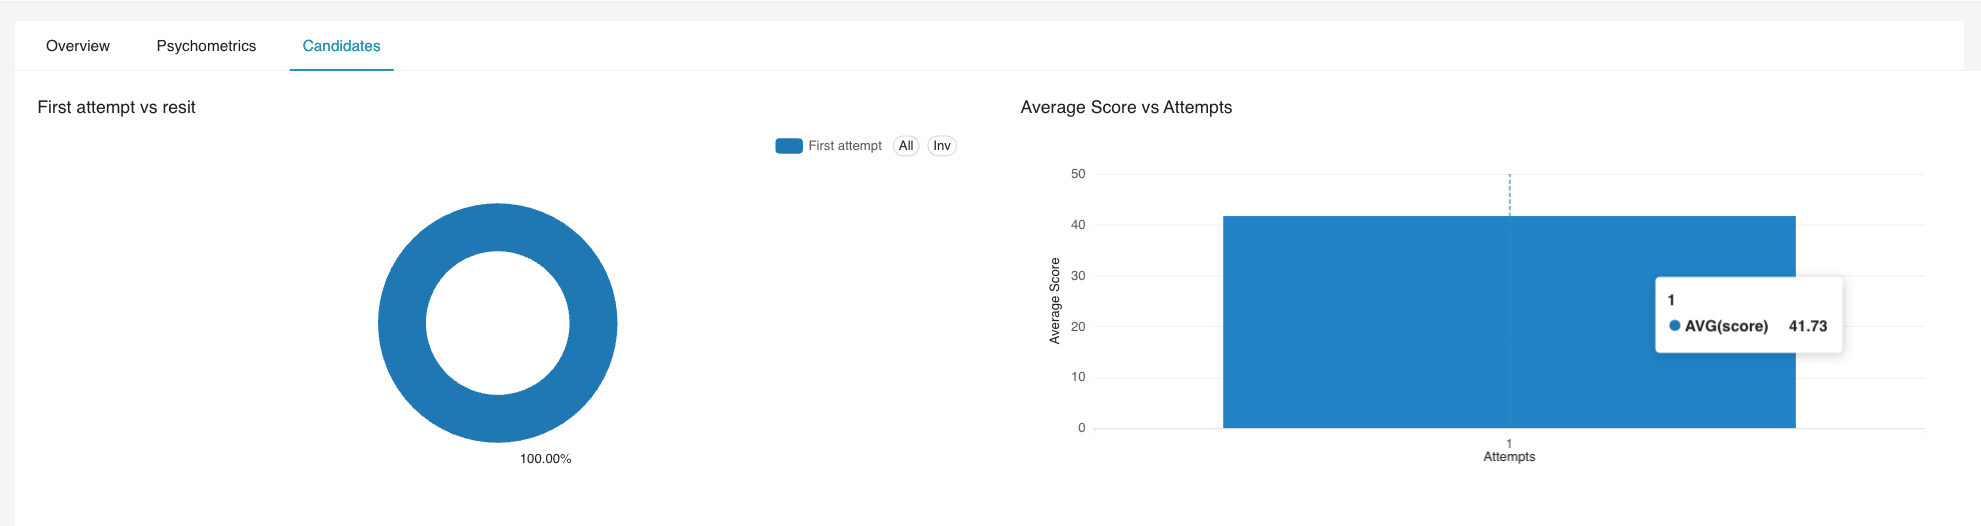
Candidates tab
The Candidates tab focuses on participation and attempt patterns.
Available graphs and metrics:
- First attempt versus resit
- Average score by attempt
- Top participants by total attempts
Filters
All Insights tabs share the same filter set:
- Date range
- Assessment
- Pass or fail status
- Exclude low-volume assessments
- Time band
Filters apply to every graph on the active tab.
What Insights does and does not do
Insights are designed and maintained by Cirrus. They cover the metrics most customers ask for and require no setup.
- Available directly within Cirrus on supported subscription tiers.
- No external tooling required.
- Preconfigured by Cirrus, not user-editable.
- Standard reporting, not deep custom analytics.
If you need a metric or breakdown that Insights does not show, you have two options:
- Request a custom Insights dashboard. Cirrus can build dashboards tailored to your organisation and add them to the Insights area. Scope and complexity are agreed with the Cirrus team.
- Connect a BI tool to the Data component and build the report yourself.
Related articles
- Data for connecting external BI tools to a Cirrus dataset.
- Statistics: RIT and RIR values for the maths behind the Psychometrics tab.
- Assessment performance for per-assessment analytics.